
Or why should one not plan transport electrification based on traffic flows – a simple example
Transport routes and charging infrastructure are important. They affect charging demand, grid load and flexibility, dynamic pricing opportunities, the feasibility of e-fleet operation, charging queues and charger utilization, charging network resilience, as well as vehicle adoption, and customer journey.
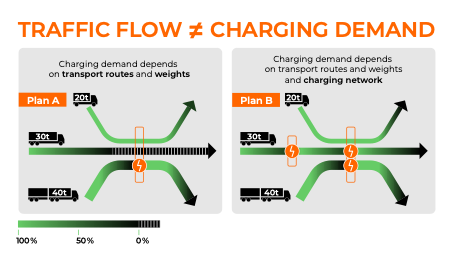
The importance of route based aspects in estimating charging demand and battery electric operations enablement (for short BEV enablement) of transport routes are shown in Figure 1. Through a simple example that makes logical assumptions about energy use and charging behavior, the Figure illustrates that
- Traffic flows (aka vehicle counts) do not contain the necessary information to accurately calculate the charging demand or BEV enablement of a single or a network of stations.
- That one cannot determine and meaningfully talk about such Key Performance Indicators (KPIs) like charging demand and BEV enablement for a single station in isolation but only in relation to a network of stations.
The latter aspects are also referred to as network dependence and network effects.
The example assumes a logical simplified energy use model that is also used in industry and in commercial practice. Namely that the energy that vehicles use is directly proportional to the transport weight (Gross Transport Weight (GTW) or Gross Combined Weight (GCW)) and the transport route, i.e., the path that the truck takes in the road network from the origin to the destination of the transport.
While the weather, the vehicles speed, the road elevation profile, and road surface along the route can substantially affect the energy use, in practice an average or worst case scenario for these variables can, should, and is assumed for long-term resource planning.
Consequently, the energy use of a transport route can be modelled as the product of the transport weight and transport route length. In the example; the width of the lines as well as the tuck symbols, represent the transport weights of three transport routes. The length of the transport routes is proportional to the depicted line length.
The examples also assume a realistic charging behavior where a truck only stops to charge at a station if the State of Charge (SoC), shown as a color shade between green (100% SoC) and black (0% SoC), of the truck is below a threshold (e.g., 30%) and the without charging the truck would not be able to reach its destination or the next station on its route.
Additionally, it is assumed (but is not illustrated in Figure 1) that the charging of a truck is limited by its battery capacity and a maximum charging time which in practice is often set to the minimum length (45 minutes) of the regulated rest stop that drivers have to take every 5 hours.
Logical assumption with plan A and plan B
Plan A on the left shows a station that three vehicles pass through, i.e., the traffic flow is 3. Yet only the 40t truck will stop to charge, representing one (1) charging session in the amount that the 40t truck needs to complete its route.
Notably, the 20t truck does not need to charge to complete its route and the 30t truck is not even able to reach the station and hence the charging network does not enable the electrification of this transport route.
In Plan B the network is expanded with a second station to the left of the first station. In this case both the traffic flow and the charging sessions is 1. The addition of the second station also enables the electric operation of the 30t truck.
Notably this also increases the number of charging sessions and the amount of charging demand at the first station. Notably, the addition of a station more often than not decreases the number of sessions and charging demand at other stations in the network because a truck has generally more opportunities to quire the same energy its needs to complete it route hence the total charging demand is spread across a larger supply of charging stations.
KPIs and Route Based Network Impacts
This impact of stations on each other are called route based network impacts in charging demand. As the example illustrated other KPIs like BEV enablement are also governed by route based network impacts. Other relevant aspects and KPIs of transport electrification that are governed by route based network impacts include:
- grid load and flexibility
- dynamic pricing opportunities
- feasibility of e-fleet operation
- charging queues and charger utilization
- charging network resilience
- vehicle adoption and customer journey
All related to the concept of BEV enablement.
Notably, the impacts of any change in the network is impossible to estimate accurately without simulating the energy-use and charging behavior of the trucks that are operated on the transport routes. Through a little though process one can also see that the impacts can propagate to virtually any part of the network and can either be positive of negative for a given KPI.
Traffic flow data do not contain the needed information
Finally, from a charging network planning perspective, the example illustrates, as it was preluded, that the traffic flows (aka vehicles counts) do not contain the necessary information to accurately calculate the number of charging sessions and amount of charging demand of any of the other KPIs.
In fact the only relation that exists between the traffic flow and the number of charging sessions at a station in a network is that the number charging sessions is always less than or equal to the traffic flow. In other words, this states the obvious that “some of the vehicles that pass by will stop to charge.” How many and which vehicles and how much they will charge are simple impossible to calculate from traffic flows.
So planning and optimizing the KPIs for a network of stations with traffic flows is doomed to yield suboptimal results. In fact, experimental results have shown that plans derived with so called route based network analytics for locations such as charging demand in network, charging demand from electrified routes, increase in number of electrified routes, and increase in ton-km of electrified routes can increase charging demand and BEV enablement KPIs by a factor of 2.5.