
Why transport route data?
As explained in the article “Importance of Route Based Network Impacts and Analytics in Transport Electrification” post, using transport routes rather than traffic flows based on vehicle counts is paramount in strategic charging infrastructure planning.
It is crucial for obtaining accurate estimates for and effectively optimizing charging demand and the number of fully electrified customer journeys through a network of stations or other charging infrastructure types (e.g., electric road segments).
Synthetic transport route data from trustable transport flow statistics
Gordian’s algorithms and data structures for lightning-fast and accurate route based network analytics are data agnostic. E.g., we can ingest transport route data from the fleet management systems of customers.
But to support customers without transport route data in planning charging infrastructures for different transports (freight vs. private cars) across all European countries, we have created synthetic transport route data for freight and private cars. In particular, we have extended and refined the data generation methodology described in the “Synthetic European road freight transport flow data” article by researchers at the Fraunhofer Institute for Systems and Innovation Research and Karlsruhe Institute for Technology (KIT).
State-of-the-Art synthetic transport route generation
Fraunhofer/KIT methodology can be roughly summarized as follows.
The basis for the synthetic freight trip generation is the ETISplus project, where 17 ETISplus partners in this from 13 countries collected Europe-wide annual passenger and freight transport flow volumes from various EU sources and EU countries and calibrated the resulting origin-destination matrices with measured traffic flows between 1,675 NUTS-3 regions (Nomenclature of Territorial Units for Statistics). The ETISplus data description and methodology are detailed here.
One key result of ETISplus is the annual transport flows (number of transports and total mass of transports in the case of freight) between every possible NUTS-3 region pair, aka the OD flow matrix. To derive synthetic routes, the Fraunhofer/KIT methodology calculates the least costs path between the centroids of every NUTS-3 region par along a simplified network with 18,447 edges, which make up all European international E-roads supplemented by other highways that are relevant for road freight transport and assigns all of the freight transport flow between the region pair along the corresponding single least cost path.
Shortcomings of State-of-the-Art:
The simplifications of the Fraunhofer/KIT methodology mean that the so-obtained transport routes between a pair of NUTS-3 regions all take the same path, and transport flows within a NUTS-3 region that often represents regional transports are not generated. It also means that the transport routes generated are confined to the simplified network and hence are inadequate to estimate charging demand on major arterial roads that may still have a high level of heavy freight traffic from regional and long distance transports. Finally, the data produced by the Fraunhofer/KIT methodology distributes the total mass of transports between two NUTS-3 regions among the corresponding transport trips equally; hence each transport trip has the same mass/weight.
Gordian refinements that eliminate the shortcomings
To correct these shortcomings, we at Gordian have extended and refined the Fraunhofer/KIT methodology as follows. We used the original and more comprehensive road network of ETISplus, which also included major arterial roads and had a total of 58,453 links. We have also eliminated the assumption that all transports from a NUTS-3 region originate from the network node that is closest to the centroid of the NUTS-3 region.
Using data from WorldPop, we have approximated the likelihood of a network node being the origin or destination of a transport route with the number of inhabitants that live closest to the network node. For each NUTS-3 region pair, we then calculated the top N most likely node pairs, routed between them, and assigned the number of transports to the routes proportional to the likelihood of the node pair or route.
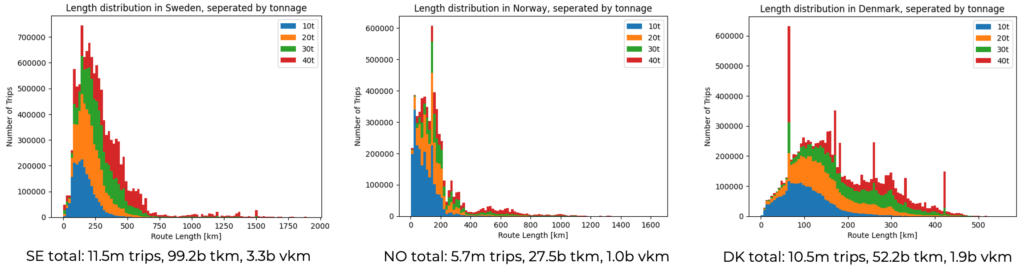
Finally, based on statistics of truck fleets and their operations in Sweden and Germany from Eurostat, we have probabilistically assigned higher transport mass to longer transport routes.
Transport route/trip statistics by length and weight by country are sown in the stacked bar charts in Figure 1. Weighs refer to the counts that have been scaled for a 2030 scenario assuming a 50% increase in transport demand. The country borders have clipped International transport trips.
Using a similar methodology without the transported mass, based on the private car OD flows from ETISplus, we have calculated routes for long-distance private car trips which allows us to support the planning of fast-charging infrastructure for private cars.