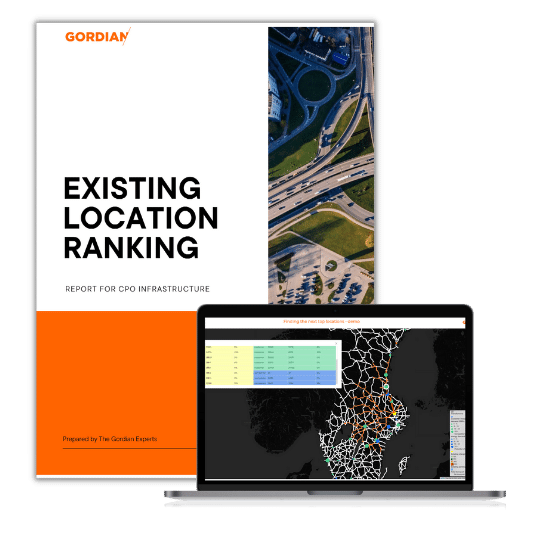
Based on your companies specific needs we create location based report and a interactive map with the locations + different data points associated with the locations which allows you to exploration of results in geographical context and gain a deeper understanding.
The interactive map enables a deeper understanding of the report and the different charging points locations. It allows exploration of results in a geographical context for a deeper understanding. Fixed customer-defined scenario and parameters and changeable analysis factor weighting.
Currently we offer the following reports:
- Existing location ranking standard report
- Potential partner analysis standard report
- White spot analysis standard report
- Customized report according to your needs
This includes a pre-meeting and the report (delivered as PDF).
Process:
- To decide the scope of the report, we start with digital meeting.
- Purpose with the report.
- Data and other parameters needed.
- The Gordian team creates a brief of the report and estimated cost for the report.
- The customer confirm the brief and cost.
- The customer delivers the external data.
- Our team of experts imports the data into the Gordian analytics tool to create the report and the interactive map.
- The estimated time for delivery is between 2-3 weeks. The exact date depends on the delivery of the needed input data.
Example of additional data:
Location of your locations properties with address, geodata, and additional information linked to properties such as area, facilities, vehicle parking, and charging capacities.